Polling accuracy in the 2024 European elections
I'd normally refrain from this sort of 'accuracy' analysis because in reality polls and outcomes can diverge for a whole host of reasons outside of the control of the polling firm. And such analysis doesn't necessarily improve the quality of public opinion polling rather it encourages ad-hoc, unjustified adjustments. In the past I had heard from a senior academic colleague of how one polling company (which will remain nameless) used to apply an additional constant to a major political party in Ireland.
Whether true or otherwise, in spite of some suggestions, I will never do that. And for good reason. In the UK in 2010 the polls underestimated Labour. They made adjustments. In 2015 they overestimated Labour. Adjustments were made. And then they underestimated them in 2017. Overall UK polling by the likes of YouGov and Opinium is pretty accurate. I'd rather be honest about the support levels of the party brands and consistent in methodology. If the polls are different from the result, it doesn't really matter. We can do additional candidate level analysis and make predictions as a separate function. Polls are not predictions.
To reiterate, there is a problem in treating one poll to be 'more accurate' when two polls are both within the range of reasonable sampling error. But also, voters can change their mind between the poll and the day of the poll, differential turnout can influence outcomes, and indeed the fact that polls themselves can sometimes influence choice (although this claim is not academically robust). So, naturally polls closer to polling day are going to be more accurate. I want to acknowledge that here because I fully admire the work of all the polling companies and don't believe the differences here to be enormous.
Making things more difficult, in this set of European elections we had an enormous number of undecideds (our telephone polling had them on over 30% even in the week of the election) opening up the possibility for a major swing as happened in 2019. I also think that in the United States organisations like 538 have a corrosive impact on public availability of quality polling. The quality gap between public and private polling there is a bit larger because there is very little PR value in public polling (until the final poll). And because 538 score polls on this relative 'accuracy' it encourages herding and predicting between polls which is not what a poll does. Predictions and the polls are separate things. Before the referendum our poll showed a marginal Yes vote, but I predicted a No vote in the Sunday Independent.
With that all said, there has been a campaign by a major political party in Ireland to undermine polling. To remove the public from public discourse and to rely more heavily on elite discourse is not particularly democratic, but not a surprising desire for a centre-right party in government. The attack is most specifically directed at 'internet polling'. Subtleties of randomised recruitment, propensity score matching and post stratification frames are evidently not fully appreciated. Indeed any rudimentary analysis of the recent referendums would show that these methods led to results that were a little bit closer.
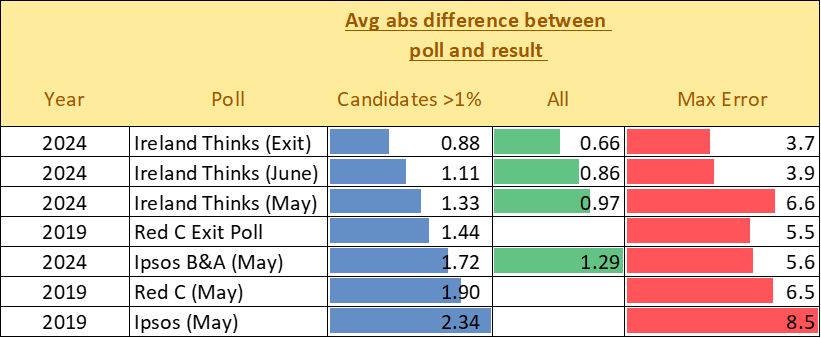
As such, in relation to the European elections, the below is a table of the mean absolute error for European election polls for candidates winning 1% or more (unfortunately polling in 2019 did not include all lower candidates).
The three most "accurate" polls are all from Ireland Thinks, and are based on online methods.
European polling is really hard, so a polling 'miss' is highly likely. I knew we were taking a major credibility risk in publishing one week out on the candidates with a margin of error of 4-5% on each. But we did it and it was closer to the result than anything before.
Normally I'd argue that such analysis of polling variation is foolhardy nonsense, which fails to appreciate random error. But in this particular election some commentators have argued that online polls were less accurate. This is demonstrably not the case.
The raw data for this is given below. Again to reiterate, the differences are mostly random.
We could argue all day about methods, it is not as simple as one method being better than another. Face to face polling is excellent and is an important part of the mix. I do face to face and get an awful lot out of it. It does have challenges. There are significant challenges with cluster sampling and choosing where those clusters are. It can also be difficult to get people who are in or to get apartments & one off housing. Monitoring a remote team can be tricky but I am reassured that face-to-face public polling in Ireland is very good.
Telephone, random digit dial surveys are the last true purely random method available. We can learn a lot from these although they are not perfect either and require considerable weighting. We completed a 5,000 person random digit sample over the month before this election, including a 1,000 sample on the week of the poll suffice to say this sample is pretty close to today's online polls in terms of the shape of the party system. It was notable of course that the decline in support for Sinn Féin did continue into polling week, and while Fianna Fáil held up a little bit more there remained a gap between it's local and national preferences.
Online polling has far bigger challenges due to being non-probability sampling. Specifically how to construct the stratification frame. It is far more involved and typically requires a serious statistician as it's not just a matter of building the model for how you do it and leaving it run. You're talking about joint distributions and synthetic post stratification frames. You're talking about measuring respondent false recall. There is constant innovation here in constructing the non-probability frame on which the online sampling is based. And the range in quality between different online polling firms is far wider and far more dependent on who is at the wheel. You may see for example the role of Stanford Professor Doug Rivers in YouGov, or Emory Prof Drew Linzer with Civiqs. It is quite often the statsy PhDs in political science who are running polls. To my regret (because I think we need a mix of face to face and online) the European Social Survey is switching to online, just as the British Election Study did in 2017 (to much debate at the time).
It might surprise that I was someone who was outspoken against non-probability sampling. But I've seen how the problems have been overcome.
Indeed at the last general election there were four online polls, three telephone polls and three face to face polls from January. The average error across the online polls was 1.3%, 1.6% for face to face and 1.7% for telephone.
For me at least it was humbling that the published online polls at the last general election conducted by UK firms Survation and Panelbase were more accurate than the published telephone polls. Subsequent data released by Red C confirmed that their online polling had tended to be closer to the result than their telephone polling.
Raw data (2024):
Raw data (2019):
Additional data from the 2009 RTÉ Landsdowne Exit poll. Mean Abs Diff of candidates over 1%: 1.65% and Max abs error is 4.7%
| Exit Poll | Result | ABS DIFF | |
| 1 'Byrne, Cllr. Eibhlin (Fianna Fail)' | 5.1% | 4.7% | 0.4% |
| 2 'De Burca, Senator Deirdre (Green Party)' | 4.4% | 4.7% | 0.3% |
| 3 'De Rossa, Proinsias MEP (Labour)' | 25.2% | 20.5% | 4.7% |
| 4 'Higgins, Joe (Socialist Party)' | 11.2% | 12.4% | 1.2% |
| 5 'McDonald, Mary-Lou (Sinn Fein)' | 14.7% | 11.8% | 2.9% |
| 6 'McKenna, Patricia (Independent)' | 3.8% | 4.3% | 0.5% |
| 7 'Mitchell, Gay MEP(Fine Gael)' | 20.8% | 23.8% | 3.0% |
| 8 'Ryan, Eoin MEP (Fianna Fail)' | 10.5% | 13.6% | 3.1% |
| 9 'Simons, Caroline (Libertas)' | 3.1% | 3.3% | 0.2% |
| 10 'Sweeney, Emmanuel (Independent)' | 1.1% | 0.9% | 0.2% |
| 1 'Aylward, Liam MEP (Fianna Fail)' | 16.4% | 17.4% | 1.0% |
| 2 'Byrne, Thomas TD (Fianna Fail)' | 6.9% | 7.2% | 0.3% |
| 3 'Childers, Nessa (Labour)' | 19.8% | 18.3% | 1.5% |
| 4 'Funchion, Kathleen (Sinn Fein)' | 7.4% | 6.2% | 1.2% |
| 5 'Garvey, Paddy (Independent)' | 1.7% | 0.7% | 1.0% |
| 6 'Grealy, Micheal E (Independent)' | 1.1% | 0.4% | 0.7% |
| 7 'McGuinness, Mairead (Fine Gael)' | 25.1% | 25.7% | 0.6% |
| 8 "O'Malley, Raymond (Libertas)" | 3.1% | 4.3% | 1.2% |
| 9 'Phelan, Senator John Paul (Fine Gael)' | 13.3% | 14.4% | 1.1% |
| 10 'Sharkey, Tomas (Sinn Fein)' | 4.4% | 4.9% | 0.5% |
| 11 'Tallon, Jim (Independent)' | 0.9% | 0.6% | 0.3% |
| 1 'Boyle, Senator Dan (Green Party)' | 3.8% | 3.1% | 0.7% |
| 2 'Burke, Colm MEP (Fine Gael)' | 13.1% | 10.8% | 2.3% |
| 3 'Crowley, Brian MEP (Fianna Fail)' | 22.5% | 23.7% | 1.2% |
| 4 'Ferris, Cllr. Toireasa (Sinn Fein)' | 13.7% | 13.0% | 0.7% |
| 5 'Kelly, Senator Alan (Labour)' | 10.1% | 12.9% | 2.8% |
| 6 'Kelly, Sean (Fine Gael)' | 19.7% | 18.6% | 1.1% |
| 7 "O'Keeffe, Ned TD (Fianna Fail)" | 4.2% | 3.3% | 0.9% |
| 8 'Sexton, Maurice (Independent)' | 1.1% | 0.5% | 0.6% |
| 9 'Sinnott, Kathy MEP (Independent)' | 9.3% | 11.7% | 2.4% |
| 10 'Stafford, Alexander (Independent)' | 2.6% | 2.3% | 0.3% |
East: Mairead McGuinness 25%; Nessa Childers 20%; Liam Aylward 16%; John Paul Phelan 13%.
South: Brian Crowley 23%; Séan Kelly 20%, Colm Burke 13%; Toiréasa Ferris 14%; Alan Kelly on 10%.
North West: Pat 'the Cope' Gallagher 21%; Jim Higgins 19%; Marian Harkin 13%; Declan Ganley 10%; Joe O'Reilly 10%.
Absolute errors:
4.5, 2.8, 3.2, 2.6, 1.4;
0.7, 1.7, 1.4, 1.4;
.7, 1.4, 2.2, 1, 2.9;
4.3, 2.8, 4.1, 4.3, 2.4
Again a larger absolute error than each of the Ireland Thinks polls
Actual result:
Dublin: Proinsias de Rossa 20.5%; Gay Mitchell 23.8%; Mary Lou McDonald 11.8%; Eoin Ryan 13.6%; Joe Higgins 12.4%.
East: Mairead McGuinness 25.7%; Nessa Childers 18.3%; Liam Aylward 17.4%; John Paul Phelan 14.4%.
South: Brian Crowley 23.7%; Séan Kelly 18.6%, Colm Burke 10.8%; Toiréasa Ferris 13%; Alan Kelly on 12.9%; Kathy Sinnott 11.7%
North West: Pat 'the Cope' Gallagher 16.7%; Jim Higgins 16.2%; Marian Harkin 17.1%; Declan Ganley 14.3%; Joe O'Reilly 7.6%. Pádraig Mac Lochlainn 9.2%; Paschal Mooney 8.7%
Member discussion