Wellingborough by election
So, we (Ian Warren and myself) have conducted a poll for the by-election. In this case a face-to-face poll in Wellingborough.
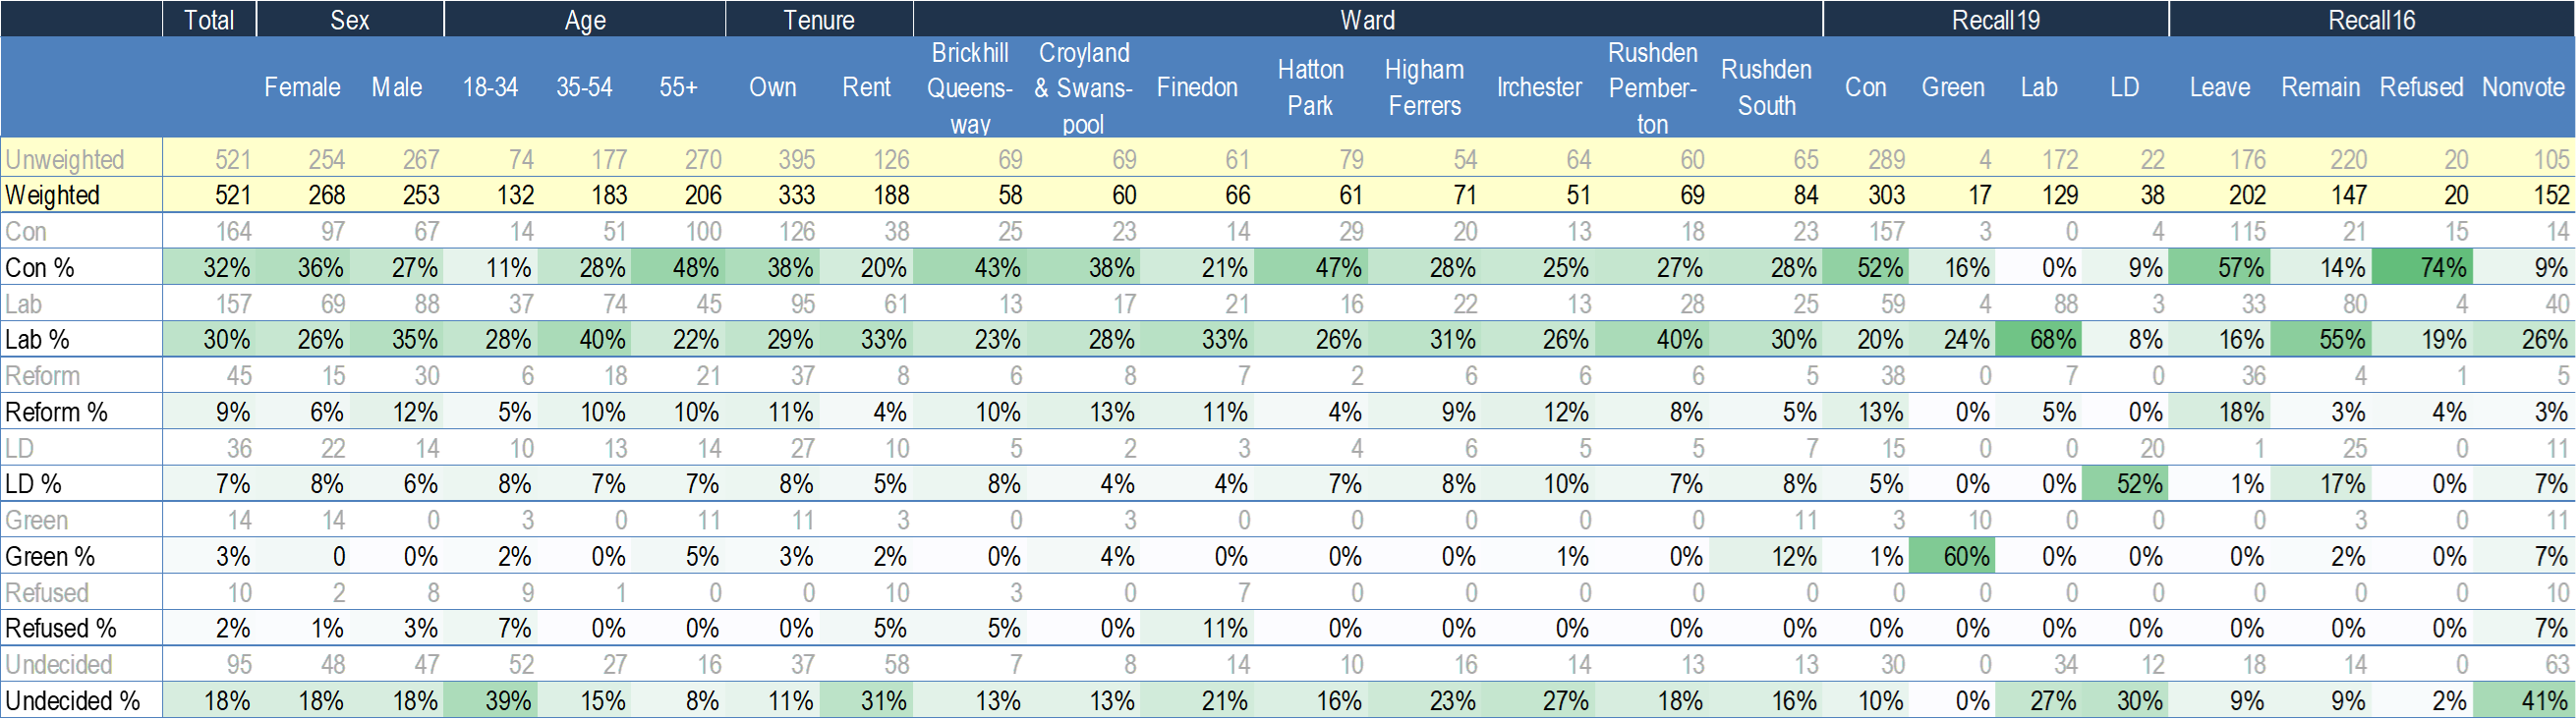
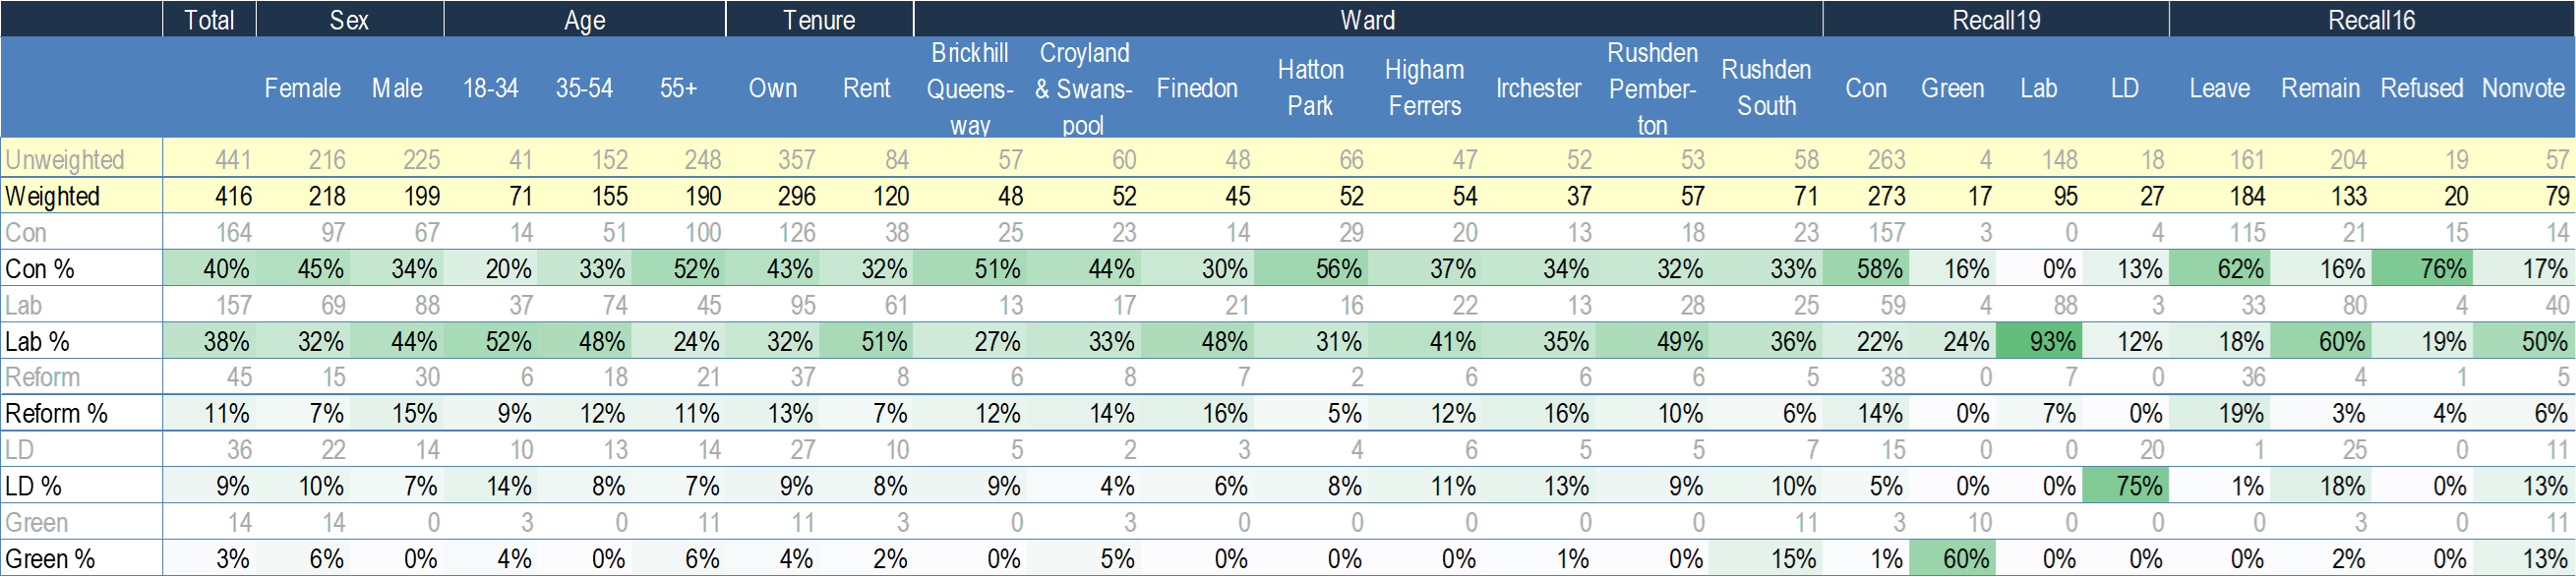
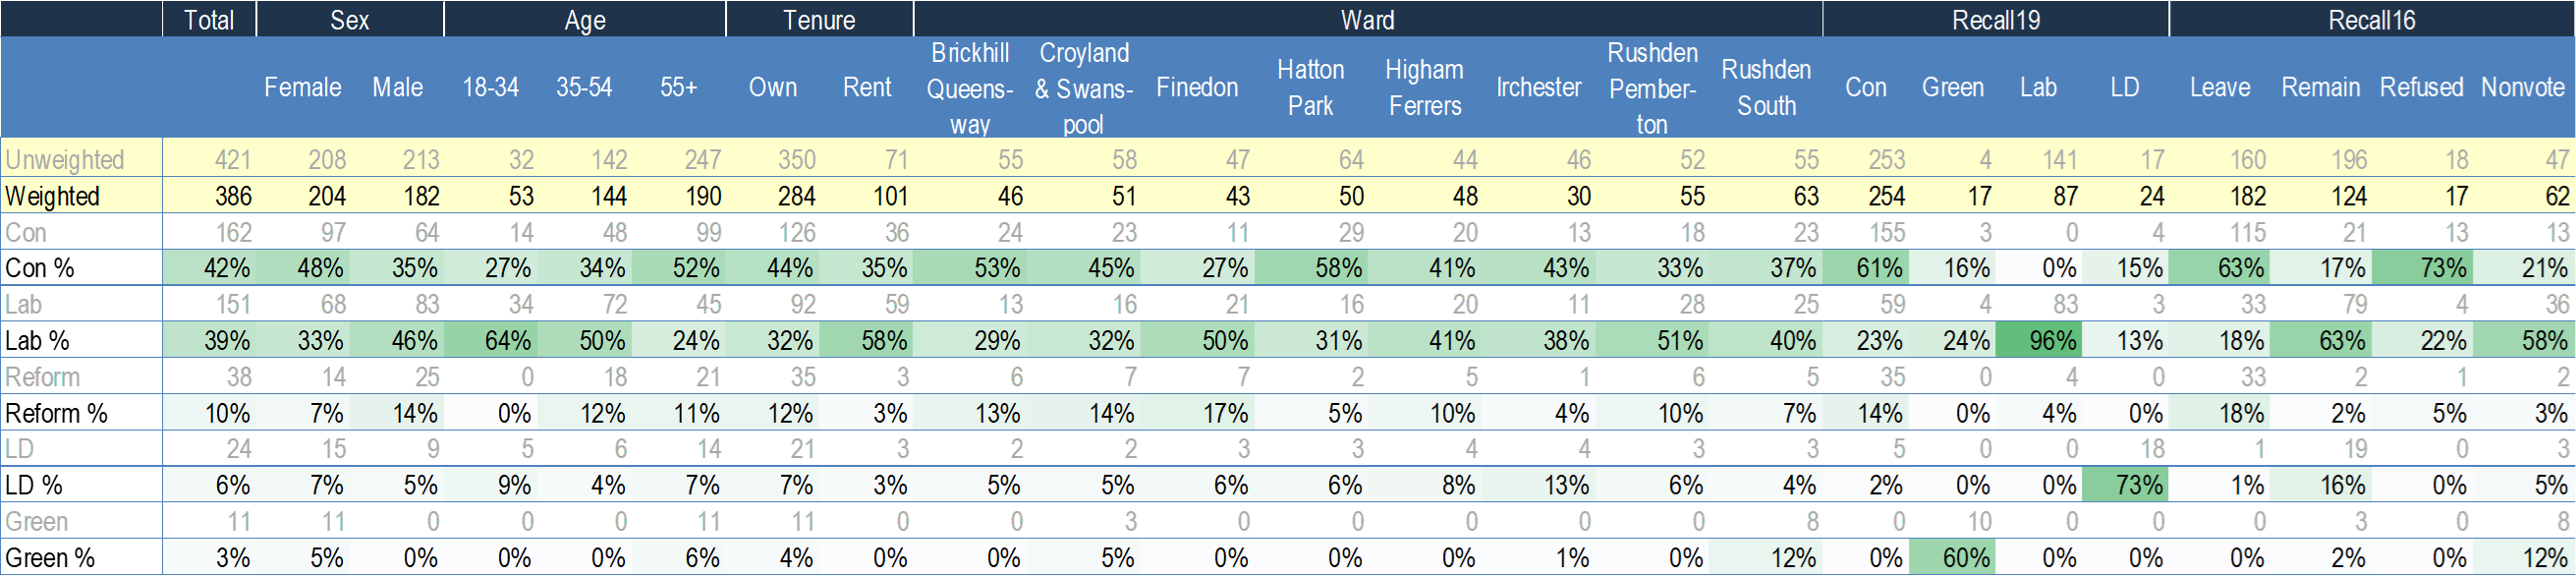
The following tables give the results (1) including undecideds and refusals (2) excluding undecideds and refusals, and (3) excluding those with a self described likelihood to vote of less than 8.
Given the relatively small sample sizes here, one would expect a 95% confidence interval of +/- 4.7%. The results suggest a close race, with the Conservatives edging it.
We're dipping our toe in the proverbial water of face-to-face polling. Principally as a test to see how it fares. Normally in a process like this, I'd prefer to keep such a test private, but the transparency of publicizing it, feels a little more liberating.
While perceived as more expensive, and posing the prospect of social desirability bias, face-to-face polling has significant benefits when it comes to constituency polling owing to having somewhat superior potential in relation to random sampling.
What was notable and perhaps surprising in the poll results was the difference between Labour and Conservative party supporters in terms of their likelihood to vote. Conservative party supporters in this sample had a significantly higher likelihood to vote than Labour Party supporters. This might be a feature specific to this by election or indeed it might be a general theme worth keeping an eye on for Labour.
What does seem to be specific to this poll is the high number of undecideds among renters and those aged under 35. Specifically unusual is the number of undecideds among those that voted Labour in 2019. Compared to national polling this a significant point of difference.
A second feature that struck me was the response rate of remain supporters (or indeed the false recall of leave supporters). It's difficult to tell the scale of the number of people falsely remembering who they voted for at the EU referendum, but to some extent there does appear to be something of it here. While we weighted according to past vote in the EU referendum, the scale of the weighting factor required for this variable feels rather large and could be explained by a known feature in politics called recall bias, where one adjusts the recollection of how they might have voted, in line with their current preference.
The two factors that contributed most to the weighting were age and the 2016 EU referendum. You can see here that we are weighting upwards leave supporters.
I hope the results are as interesting to you as they were to us.