EU Election undecideds update
There is no doubt that a large section of population remains undecided even at this late stage.
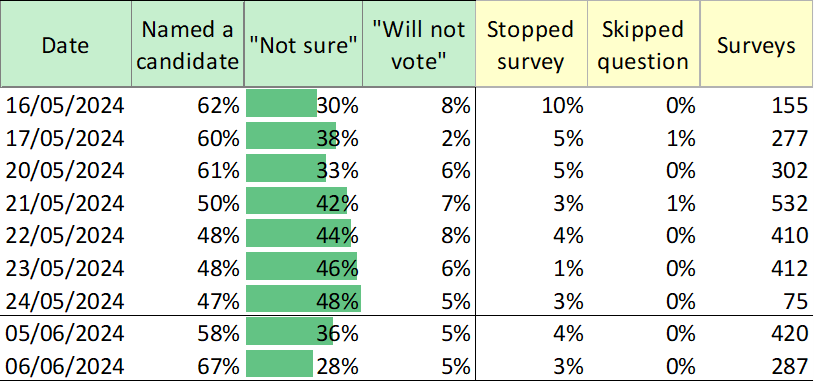
The table below illustrates the percentage of survey respondents who indicated that they were "Not sure" in response to the standard voting intention question for these European elections.
You will also see in the table that the 'Not Sure' % rose in the period up to the 24th and has declined relatively sharply in polling done this week. The Not sure % here is expressed as a percentage of those that completed the poll (the columns in green). While the decline is welcome, a lot of voters are going into polling day still unsure of who they will vote for.
The table also shows the %'s that stopped the survey and skipped the question as a percentage of all surveys. I thought it was also interesting that the %s who stopped the survey seems to have slightly decreased over time. These people were in all likelihood not sure or not interested.
Are the undecideds just non-voters?
You will also note in the table above the very small number of people that say that they will not vote. Way smaller than the actual % of nonvoters. This is for two reasons, firstly people tend to overestimate the likelihood they will vote and secondly polls tend to get a sample of people with a relatively higher propensity to turn out. Not everyone will do a poll and especially those less interested in their civic duty. While the latter is somewhat partially resolved by weighting/quotas/matching strategies I would however emphasise the former here as when we ask about whether people voted in the referendums we do get 32% reporting that they did not vote. This is also an underestimate of the share of this sample that actually did not vote as the literature does suggest that people over-report having voted, especially in the way we ask the question here. And suggest that our sample is not a million miles off.
While of course some of those that state "Not sure" are more likely not to vote it is not true to say that those that those that are 'Not sure' are non-voters. Based on some previous experimentation in elections in other countries I'd say that while their rate of turnout would of course be lower than those that issue a preference, most still do vote.
The upshot is that these people matter. Some pollsters such as YouGov are using models to predict the behaviour of undecideds drawing on their demographics to ascertain where they are likely to go based on the rest of the sample. I think it makes sense in some respect as their panel data would be able to show how people do tend to tend towards the voter preference of their broader demographic over the course of a campaign.
Shy voters?
Of course there is the great possibility that these people are being coy about who they intend to vote for. Perhaps they are less forthcoming with a preference of a relatively right wing candidate over the phone [1].
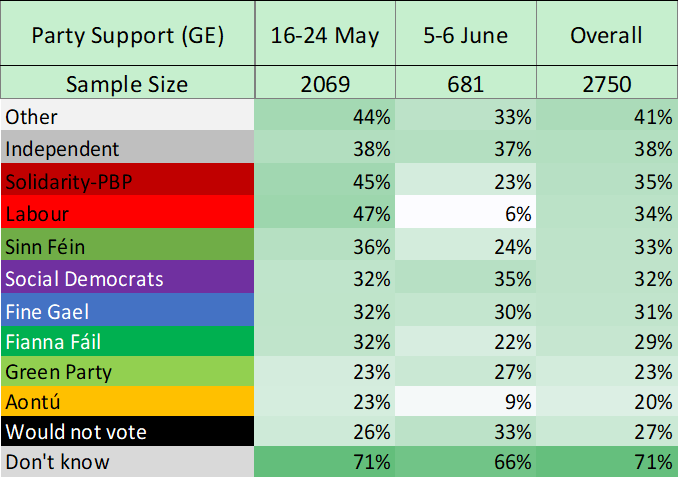
The table below shows the share of undecideds within each voting preference. So for example, in our polling data from the 5th to 6th of June, 37% of those that support 'independents' when it comes to the general election still remain undecided for the European election.
The columns are divided according to the polling period. We have a relatively limited sample of 681 from this week so figures like the Labour figure or Aontú should be taken with a grain of salt.
Those that support Independents and Others are at the top of the list. Other parties tend to be (though not all) supporters of far-right parties. This was a poll conducted over the phone, and as such could potentially suffer from social desirability bias. Or indeed, it is possible that supporters of these parties may not break towards a candidate and therefore may not turn out.
We saw in the referendum our telephone research was less reliable than SMS delivery for identifying the No vote [2]. So perhaps there is a shy conservative issue here.
Groups of voters may be floating between different options. Labour and Soc Dem voters may have floated between the various left wing candidates in Dublin and then outside of Dublin their choice is far more strategic given the relatively low chance of success. Perhaps Green and Aontú supporters have had clearer preferences. Perhaps Solidarity voters were split between Daly and Smith, (They are almost all in Dublin anyway), and have lumped for Daly.
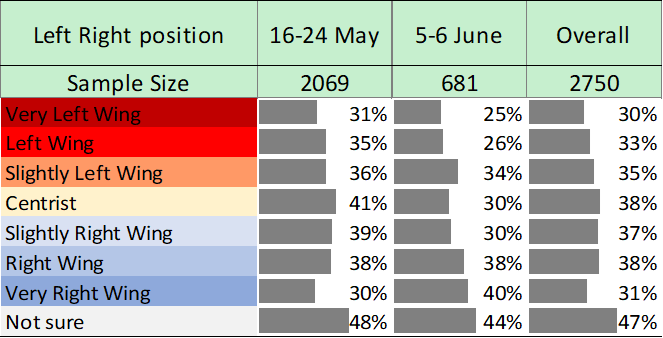
In terms of left and right the data suggests that marginally more right wing voters are 'not sure'. Those that are not sure of their left-right placement also tend to be less likely to know their choice. There is a rich literature on late deciders and this would align with that.
Of course there are still enormous numbers of those that are not sure on the left of the spectrum but there is a lot of uncertainty on the right also, particularly in the last two days.
Notably between the 16-24 May period and the 5-6 June period it would appear that a number of left wing voters have identified their preferred candidate. While the 681 sample isn't big enough to produce a weighted poll this might explain a late increase in support for Clare Daly in Dublin, and perhaps some consolidation for Grace O'Sullivan in Ireland South.
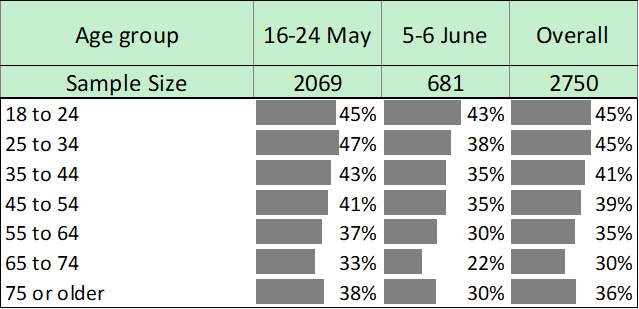
The undecideds are also clearly younger. This follows the typical pattern of late deciders being those who might know slightly less (those younger and those not sure/centrist re: left-right) and are in the phase of learning about the political process and their options.
The data for this analysis was gathered using random digit-dialling. Dates given above. The data is not weighted so it is not a representative sample, but it is relatively close one, given the methodology
[1] This is one of the main reasons why we have switched to an online, more private environment for our polling, it also gives respondents the time and space to think about their choice and is closer reflection of how voting is actually carried out. I think the effect of secrecy is underestimated. While not comparable, it does remind me of the difference between the seismic impact of the Secret Ballot Act in 1872 as compared with various expansions of the franchise.
[2] We also know from the exit poll that face to face is slightly worse again. It is not a new thing but in fact, as a result of Brexit, something that shifted the UK polling industry definitively towards an online delivery of survey research (there has been to my knowledge only one non-online published poll in the election campaign over there).
Member discussion