Hockeystick surges, late deciders and European Election undecideds
Hockeystick surges
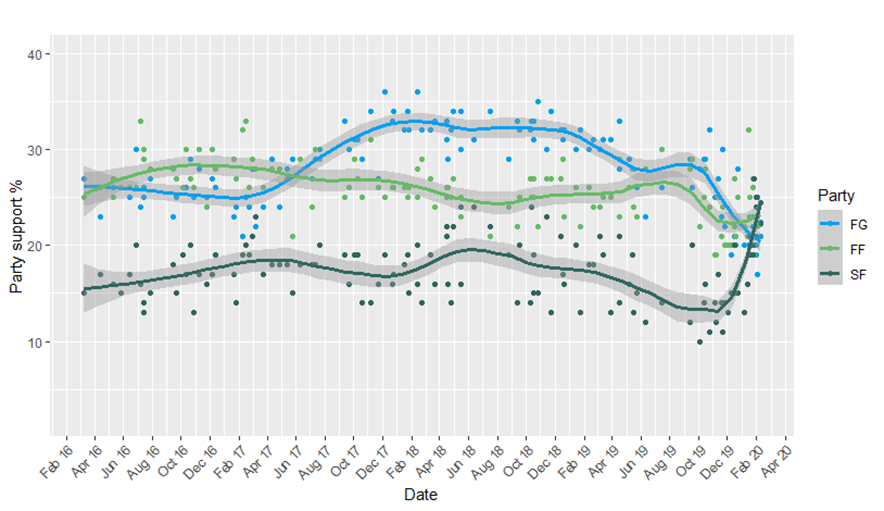
Increasingly elections are determined by late surges. We only need to look at (1) the recent referendums, which showed the Yes vote unravelling in a matter of days, and (2) the 2020 general election when support for Sinn Féin rose dramatically when the general campaign proper began one month before. The chart below shows how support for Sinn Féin was relatively steady for almost four years, prior to the election.
By the preconceived wisdom of political science this dynamic is quite unusual as it is often argued that campaigns typically amount to only minimal changes in voting preferences.
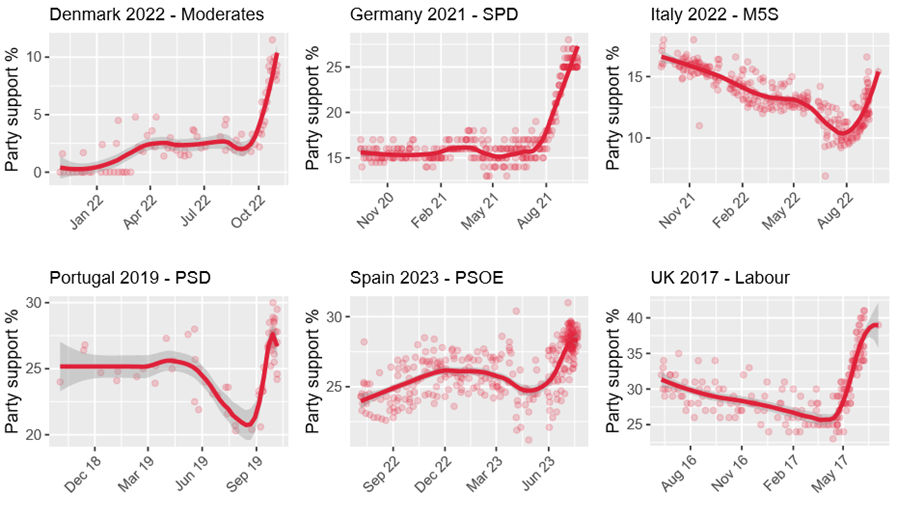
However, Ireland is not the only country for which this hockeystick surge has occurred. The next set of charts show similar hockeystick surges for political parties in other elections. In each case the surge happens approximately one month from polling day. Only when the campaign has begun.
It reflects the fact that truly enormous numbers of voters are changing their preferences. Before the financial crisis relatively few changed who they voted for from one election to the next. In EACH of the 1997, 2002 and 2007 elections 28% reported having voted for a different party in the previous election. In 2011 this rose to 47%. That happened in the context of a financial crisis and the near-total the collapse of Fianna Fáil’s vote. What perhaps was less explainable is how this volatility continued for the next two elections with 40% and 42% changing the party they voted for in the 2016 and 2020 elections (INES post-election survey analysis).
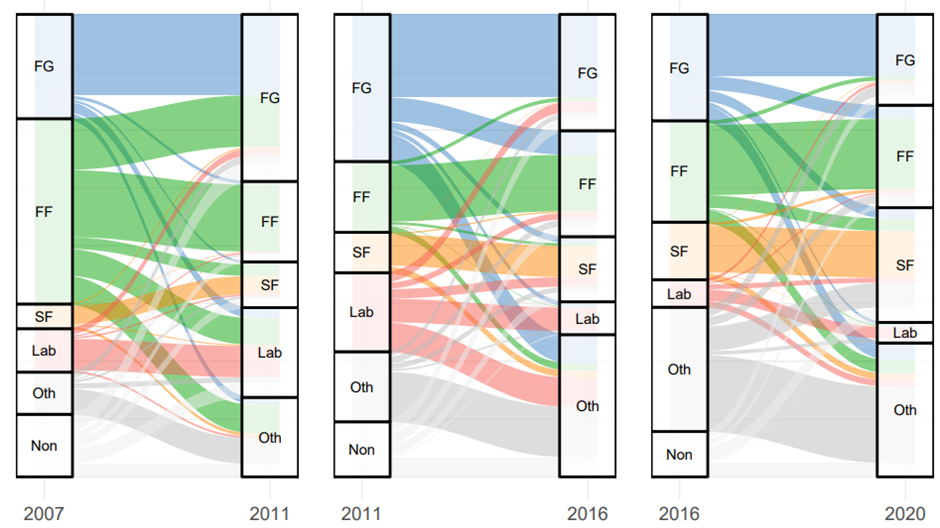
The 2020 election is the most interesting one. In aggregate terms party vote shares did not change quite as much as they did in 2016 or 2011. For example, Fianna Fáil declined by just 2.1% and Fine Gael by 4.7%. However, in 2020 lots of this switching happened beneath the surface. e.g. large numbers of Fine Gael voters switching to Fianna Fáil and similar numbers switching from Fianna Fáil to Sinn Féin, leaving the Fianna Fáil vote therefore relatively stable.
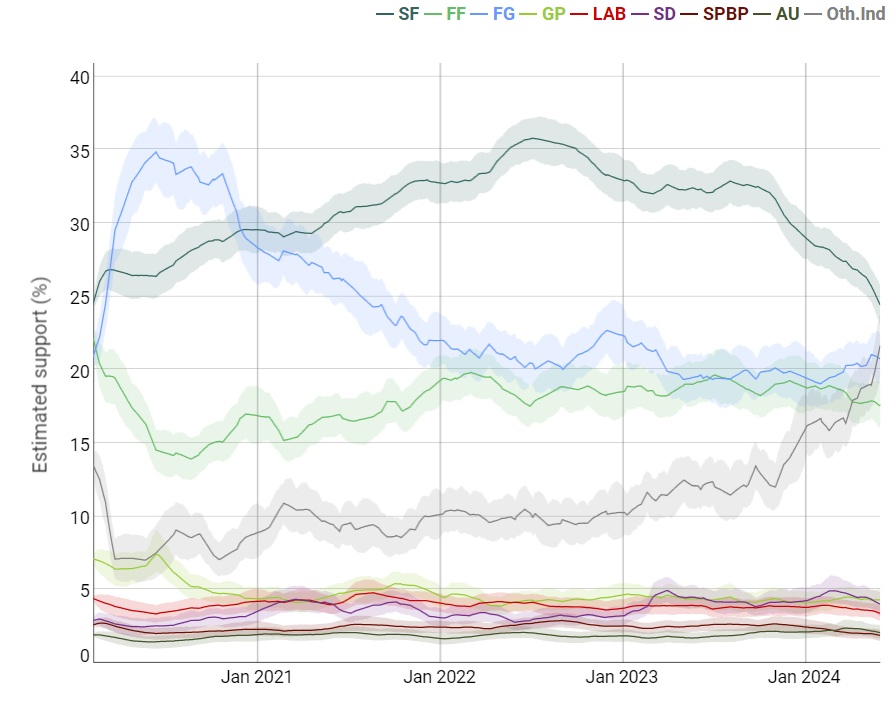
It should not have been surprising then that in the years that followed the 2020 election Fine Gael support surged to 35% and within two years declined to 20%, while Sinn Féin surged to 37% by mid-2022 and are now back down again with Fine Gael. Voters are moving around and right now, during an election campaign they are moving at quicker pace.
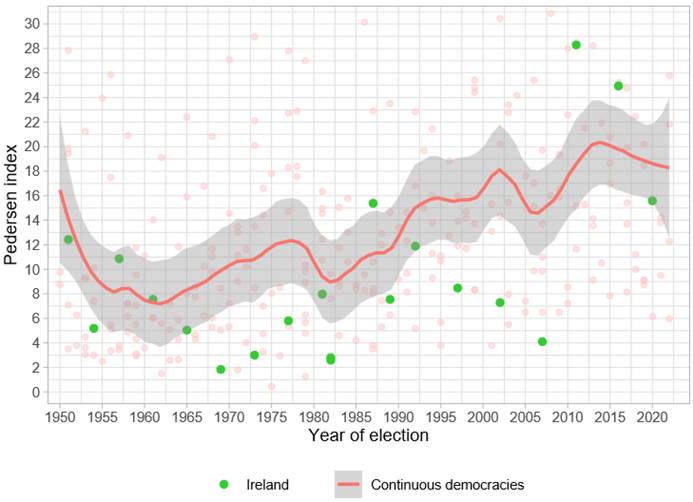
This dynamic seems likely to continue as it reflects a trend that can be observed across elections. The chart below shows this rising volatility. The red dots are the Pedersen indexes for elections across democracies that have been in existence since 1950. That is, the average absolute change in party support in each election.
So the one thing we could be certain of was that voters would start moving around when the campaign began. This leads us to a key question: who are the late deciders?
Late Deciders
To summarise the academic research, there are two types of late decider: The uninitiated and the cross-pressured.
The uninititated is the the person who simply knows less about politics and the choices on offer. They are either less interested in politics or simply younger, in which case it might be their first or second election. They are essentially learning about the parties and the process and want to figure out which party represents their interests. When we ask voters about whether they consider manifestos and policy promises to be important it is usually only younger people that find these to be of use. It is also usually only younger voters that engage with voter advice applications.
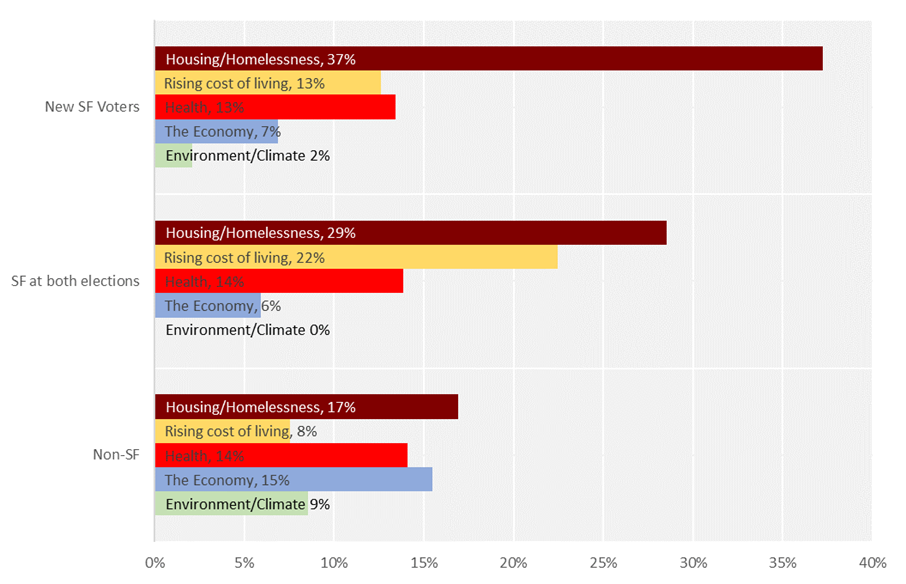
While academics have previously suggested that these late deciders select parties in a ‘near-random’ fashion and therefore do not influnce the outcome, I'd argue that that, at least in the 2020 Irish election a particular cohort of younger voters concerned with housing rallied behind Sinn Féin, again I would argue as a consequence learning that this was the steongest party on that issue. While for most it was clear Sinn Féin was the most popular party on the issue of housing, this was not necessarily known to all voters. Those that switched to Sinn Féin late in that campaign were disproportionately younger and disproportionately concerned with housing. If it were obvious to them before that point then it would have been baked into Sinn Féin's vote all along. Today those that are swinging in behind the independents are disproportionately concerned with immigration. It has perhaps only recently dawned on them that independents seem to be the most popular party for this issue.
The cross-pressured voter is someone who holds conflicting positions. Perhaps they like the leader of one party but the brand of another. E.g. they like Micheál Martin, but prefer Fine Gael. Perhaps they are right wing or at least not left wing and don't quite agree with Sinn Féin's left-wing rhetoric but want to vote for a working class party advocating for change. This is simple characterization describes another voter that swung in behind Sinn Féin at the last election. This particular type of voter appears now to have shifted to the independents there are lots of cross-pressured voters.
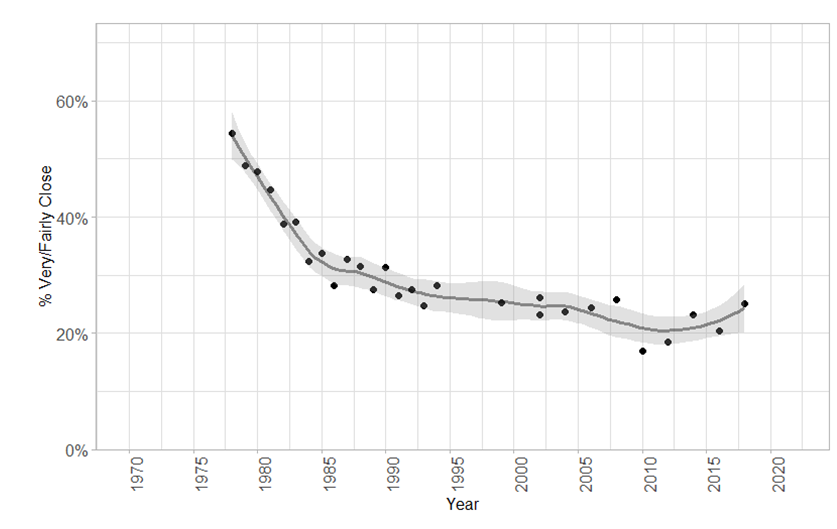
The reason why this cross-pressuring is meaningful at all is because partisan loyalty has declined significantly over recent years. In previous decades this might have helped to sustain some loyalty to parties.
European Election undecideds
So, now for dessert. There are lots of late deciders in this set of European elections. So much so that the polls will invariably be rather different to the result simply because an enormous number are not sure or at least not clear on who they will vote for. They are too numerous to behave essentially 'at random'.
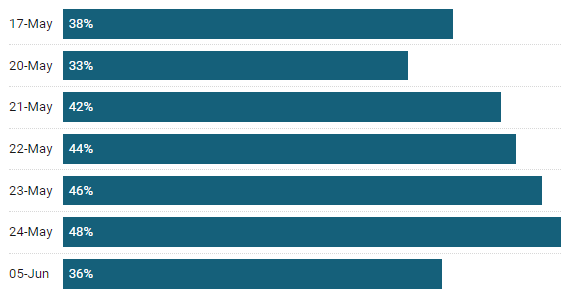
So, who are undecideds in the European election? The following analysis is a based on random-digit dial polling. A total sample of 2,472 conducted between the 16th of May and the 5th of June. I'm producing this as unweighted data (to reduce design effect variance and of course because I'm lazy here, cross tabs especially when a random sample can sometimes be more informative if left unweighted).
The numbers of undecideds are of course staggering and haven't declined very much even two days before polling day. It means that if they become decided the pattern will absolutely differ from our published results. And bear in mind we're asking them if they're leaning in any direction as well to get some response out of them.
When we break it into demographic components it shows that younger people, renters and those living with their parents are more likely to be undecided. Absolutely in line with expectations above of course but it's not just younger people here as we still have 30%+ of all age categories.
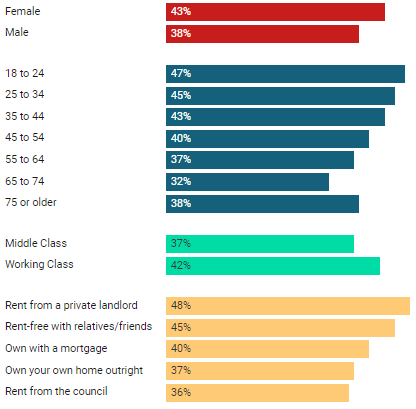
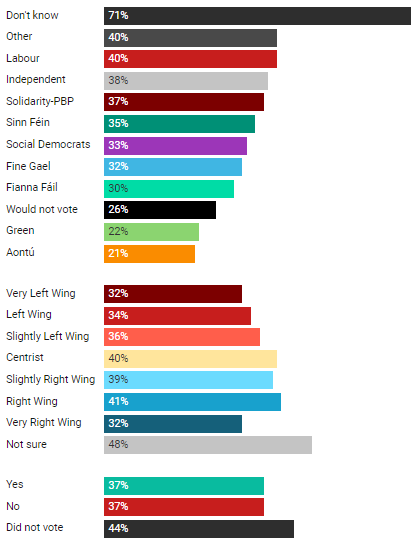
Similarly, in line with expectations, those without a left-right placement also tend to be undecided. Those that are undecided about who to vote for in the general election also tend to say they are undecided. Nonvoters in a prospective general election also tend to also be nonvoters when it comes to the European elections.
It also shows that slightly more independents and slightly more right wingers tend to be undecided. The independent voter actually has a lot of options and perhaps for that reason is unsure about their preference. But that means that we should expect independent support to increase. One practice to deal with undecideds being used by YouGov in the UK is to model them, to essentially predict who they will vote for on the basis of the data that you have. This would have quite an impact on our estimates.
In reading these numbers one must be mindful that the numbers here are all given within category so although the % Yes and % No figures are similar on 37% there are far more No voters from the referendum than there are Yes voters and therefore the undecideds that voted No in the family referendum outnumber undecideds that voted yes by a margin of 68 to 32.
Member discussion